Nielsen: Trump’s State of the Union Drew 32.6 Million TV Viewers, Down More Than 10% From Last Year

An estimated 32.6 million people across 23.2 million homes watched President Donald Trump deliver the 2026 State of the Union address on Feb. 24, according to new Nielsen data.

The tally is down almost 11% from Trump’s March 4, 2025, State of the Union address, which generated 36.6 million viewers.

Both totals pale in comparison to Trump’s first term speeches as president that generated State of the Union viewership of 47.7 million, 45.5 million, 46.8 million and 37.2 million, respectively.

While coverage varied by network, 15 networks televised the address from approximately 9:12 to 10:59 p.m. ET — with concurrent live streams where available.

Subscribe HERE to the FREE Media Play News Daily Newsletter!

Nielsen: Disney Ups January Household TV Market Share Thanks to Football, News

In a month where television viewing reached a 12-month high, Disney captured the largest month-over-month gain in Nielsen’s January Media Distributor Gauge report, a monthly view of total household TV consumption aggregated by parent company.

Disney added 1.2 share points and finished with 11.9% of total television viewing in January, nearly tying its Media Distributor Gauge best (12% in January 2025), and bringing it within 0.6 share points of YouTube’s 12.5% market lead.

Disney’s momentum was primarily fueled by ESPN’s coverage of the College Football Playoffs and Championship games, which drove an 82% monthly viewing increase on the network and contributed nearly a full share point to Disney’s total.

Disney also got a boost from its ABC affiliates, with viewing up 10% on the strength of multiple NFL games, the Citrus Bowl, the return of broadcast dramas, and seasonal staples such as “New Year’s Rockin’ Eve” and “The Rose Bowl Parade.” ABC’s “High Potential” and “ABC World News Tonight” were notably the top broadcast programs in each of their respective genres in January.

Netflix represented 8.8% of TV usage in January and maintained the No. 3 rank among distributors. Netflix’s overall usage was up slightly at 1%, and its original series “Stranger Things” claimed the top streaming program for a second consecutive month.

NFL games carried on NBC, plus streaming simulcasts on Peacock, were a key factor in the 5% overall increase to NBCU-Versant. Peacock also benefited from a new season of its original series “The Traitors.” Additionally, Telemundo affiliates saw a 13% jump in viewership powered by the sports reality hit “Exatlón,” bringing the network’s monthly share contribution to 0.7 points. Overall, NBCU-Versant represented 8.5% of TV viewership, up 0.3 points vs. December.

Fox climbed to 7.4% of TV viewership (+0.4 points). This growth was largely underscored by a 17% jump in viewing on the Fox News Channel, which accounted for more than half (+0.25 points) of Fox’s monthly share increase.

Led by increases on FYI (+46%) and Lifetime (+14%), A&E’s combined viewership climbed 8% (+0.1 point) and moved up one slot in the distributor rankings.

Subscribe HERE to the FREE Media Play News Daily Newsletter!

Nielsen: Netflix’s ‘Stranger Things’ Returned Atop Weekly U.S. Household TV Streaming Through Jan. 25

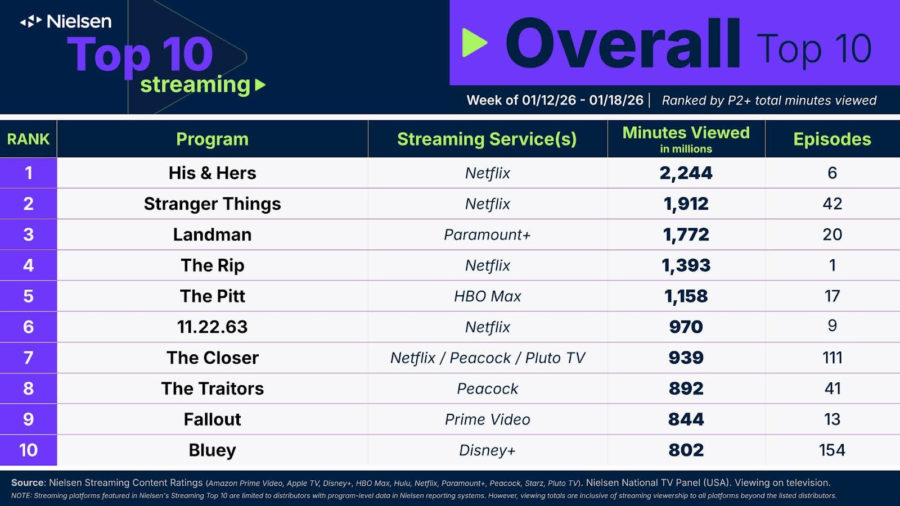
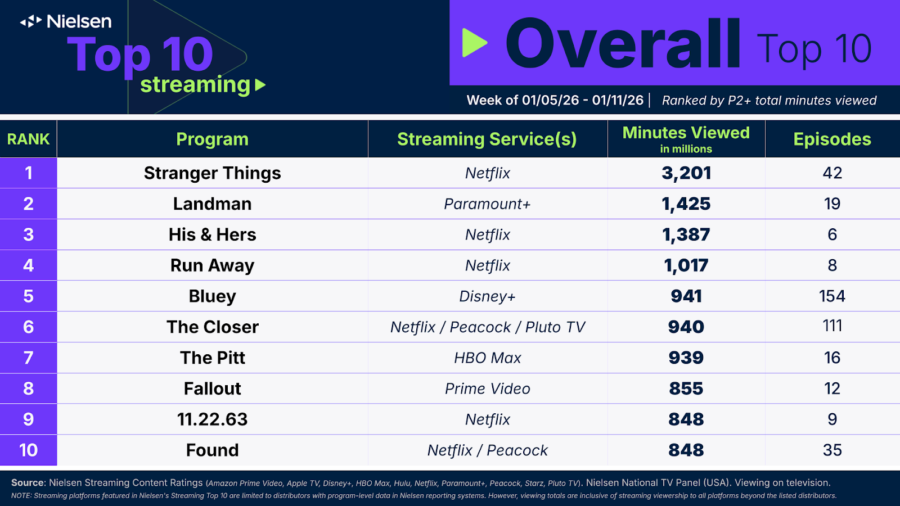
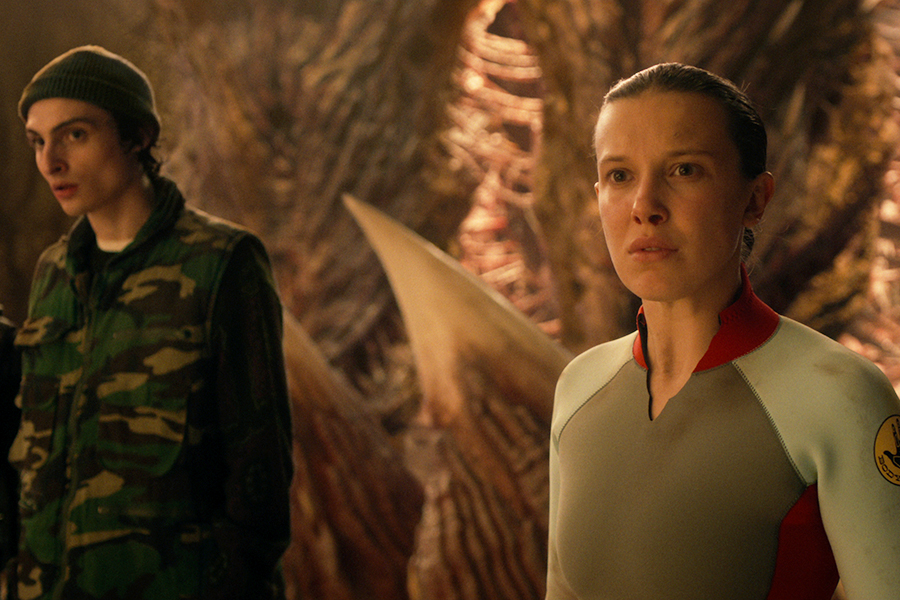
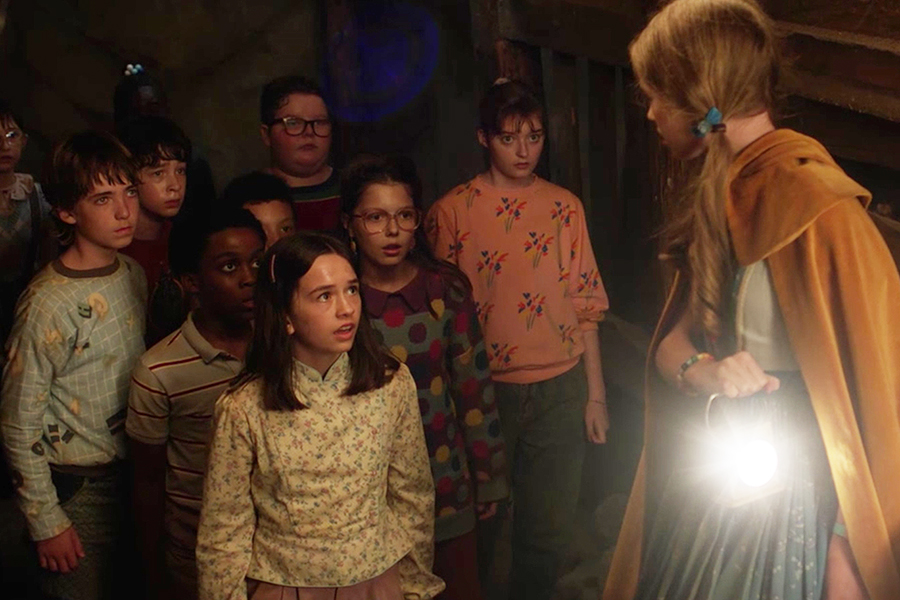
The Netflix original sci-fi drama “Stranger Things” returned to No. 1 overall on the weekly Nielsen U.S. household TV streaming charts with 1.66 billion minutes streamed through Jan. 25 — three weeks after the series finale aired on Dec. 31, 2025.

“Landman” on Paramount+ (1.62 billion minutes, No. 2 overall) celebrated a 10th consecutive week in the overall top three following the conclusion of its second season on Jan. 18.

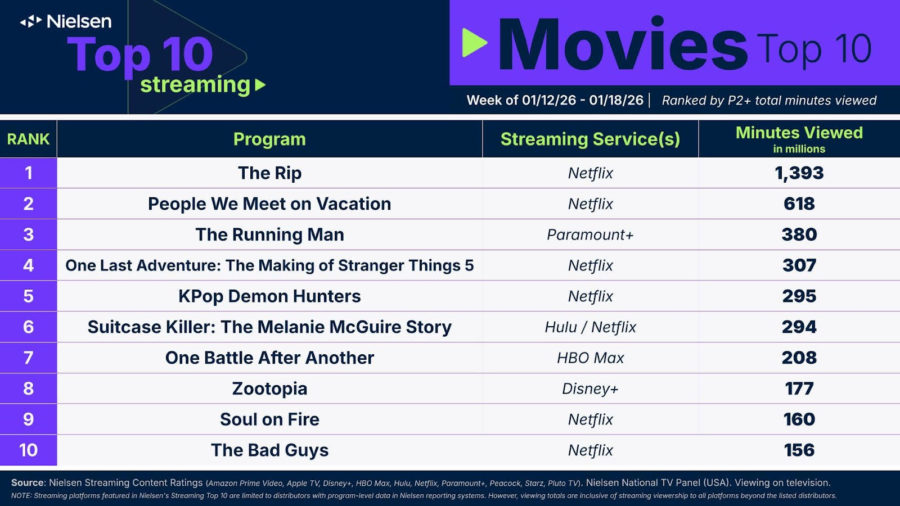
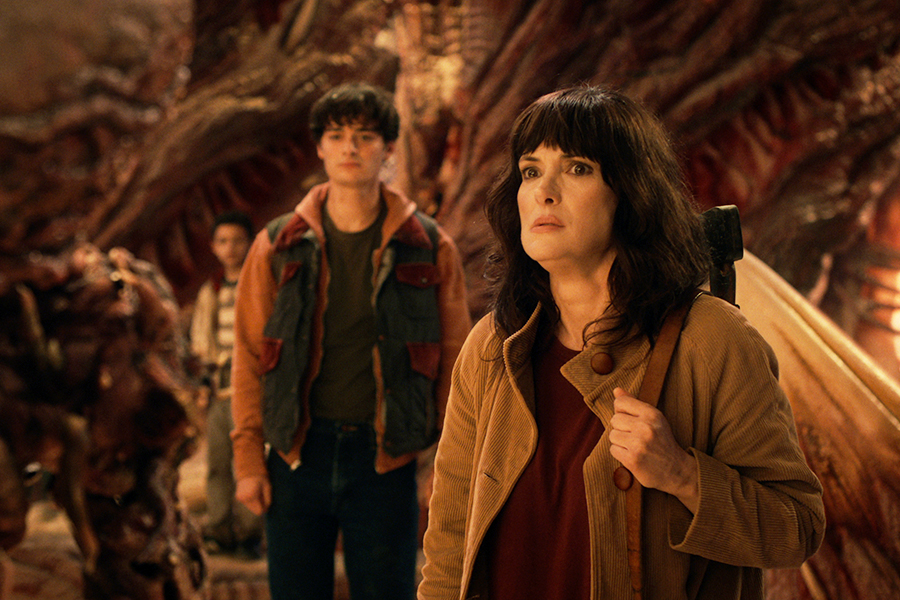
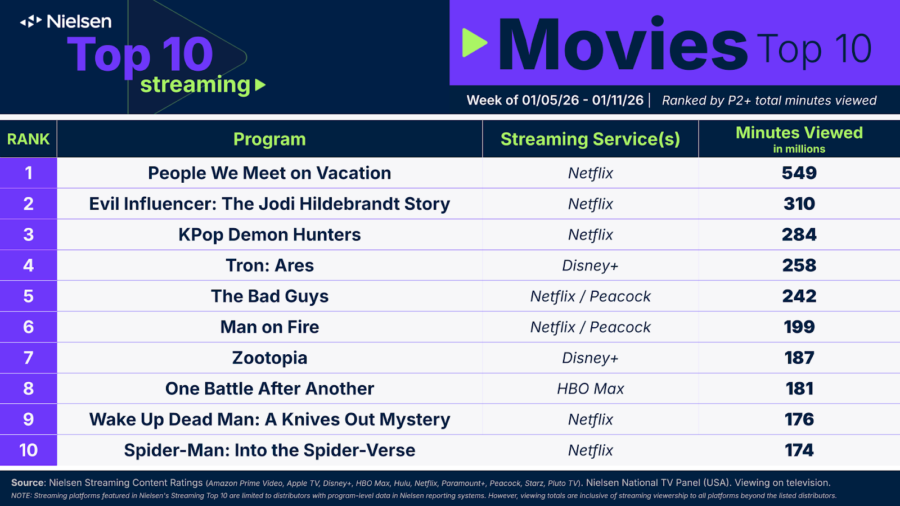
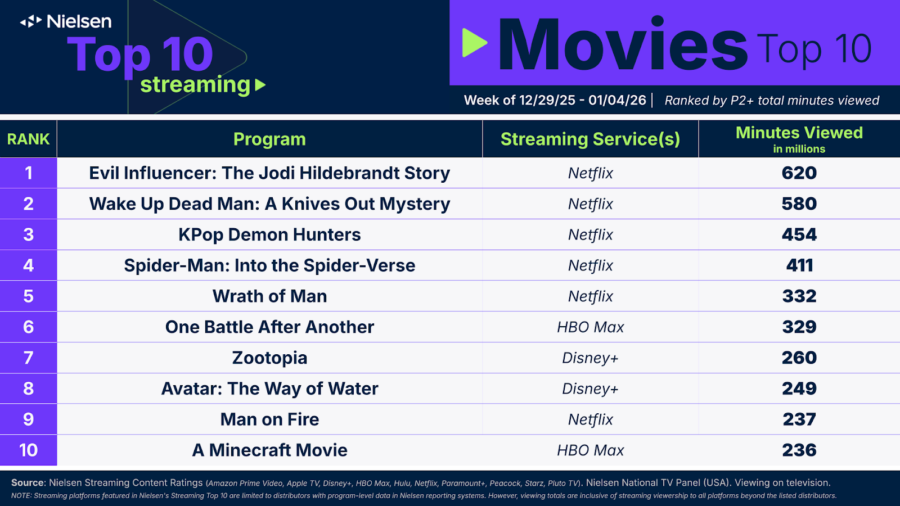
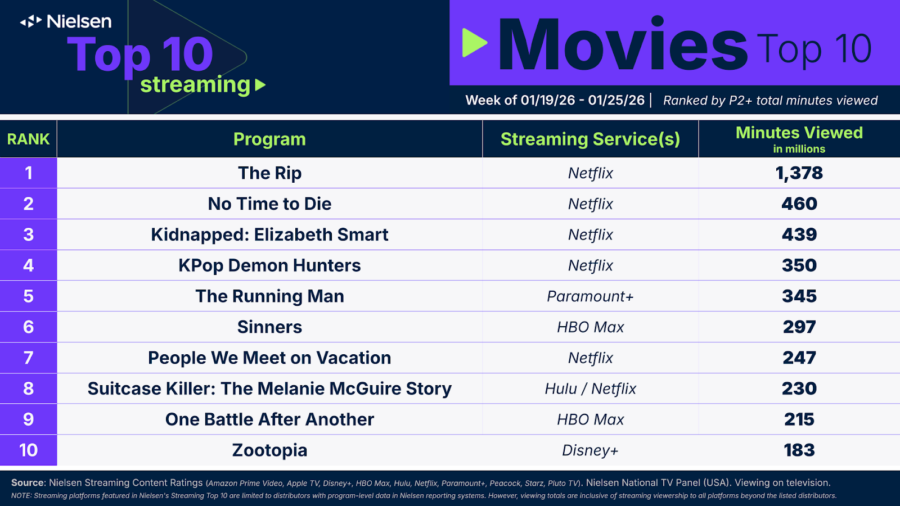
The Netflix original crime movie The Rip, starring Matt Damon and Ben Affleck, rounded out the top three with 1.38 billion minutes. For the second week in a row, the film secured No. 1 on the movie chart, holding steady in its second week of availability.

Netflix’s mystery series “His & Hers” finished at No. 4 overall (1.37 billion minutes) after hitting its third consecutive billion-minute week since its premiere on Jan. 8.

Both titles had similar audience profiles from an age perspective, with adults 35-64 being the core demo (57% for The Rip, 56% for “His & Hers”), though the latter skewed considerably more female (62%). The Rip viewership was evenly split between male and female viewers.

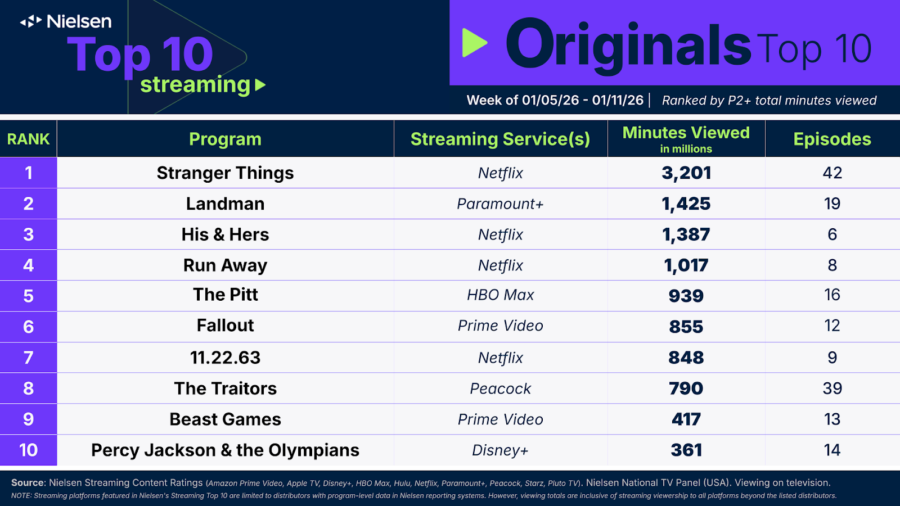
HBO Max’s ER drama “The Pitt” continued to move the needle on its weekly performance. The third episode of the new season dropped on Jan. 22 and contributed 27% of the show’s 1.19 billion minute total (No. 5 overall, No. 4 among originals). The three available episodes of season two represented 49% of the program’s viewership. In other words, half of viewing went to the first season, suggesting that viewers may be going back to older episodes, or perhaps digging into the show for the first time.

Netflix’s romantic drama “Bridgerton” returned to the originals chart (421 million minutes at No. 9) for the first time since July 20, as fans of the show anticipated the fourth season release on Jan. 29.

Following it at No. 10 was the Netflix comedy “The Upshaws” with 416 million minutes, which dropped its fifth and final season on Jan. 15. Black viewers accounted for 73% of its watch time, the most of any other top 10 title this week.

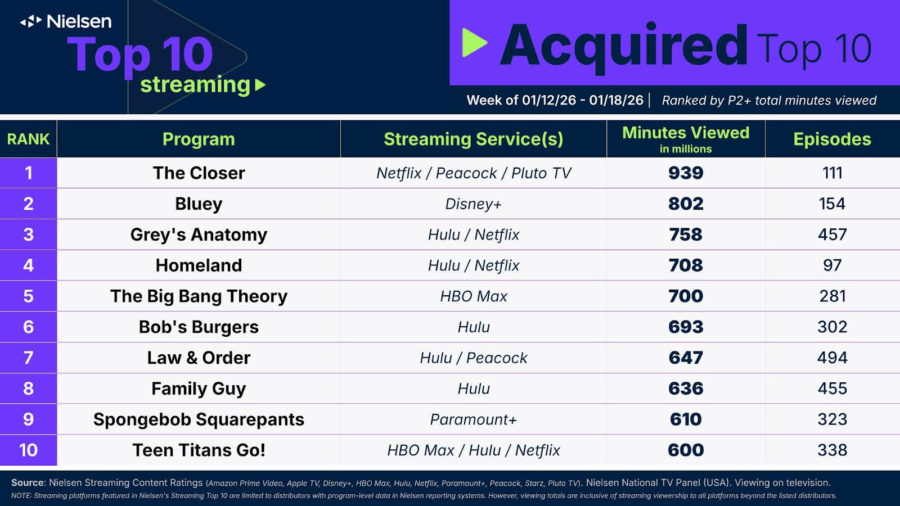
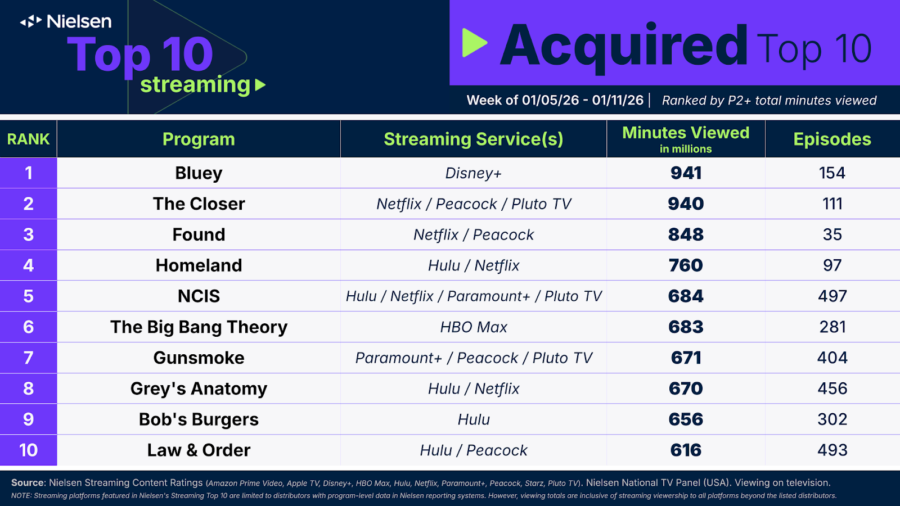
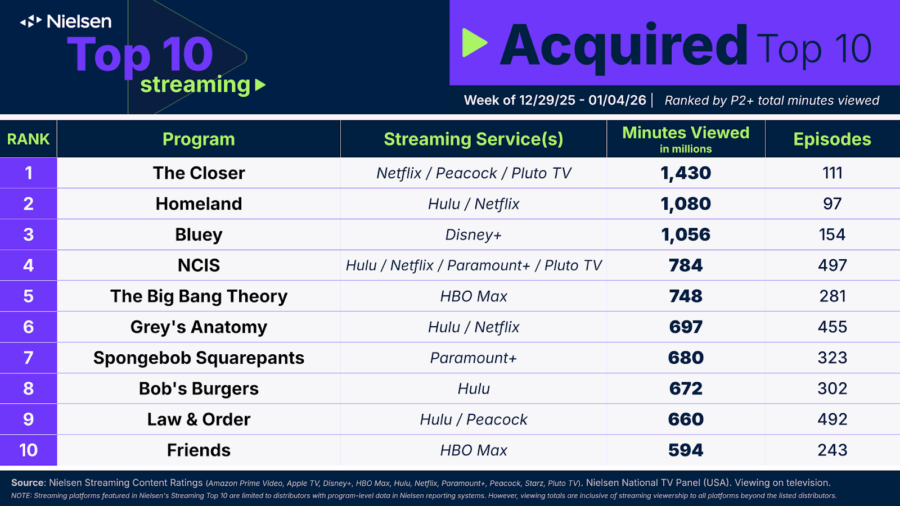
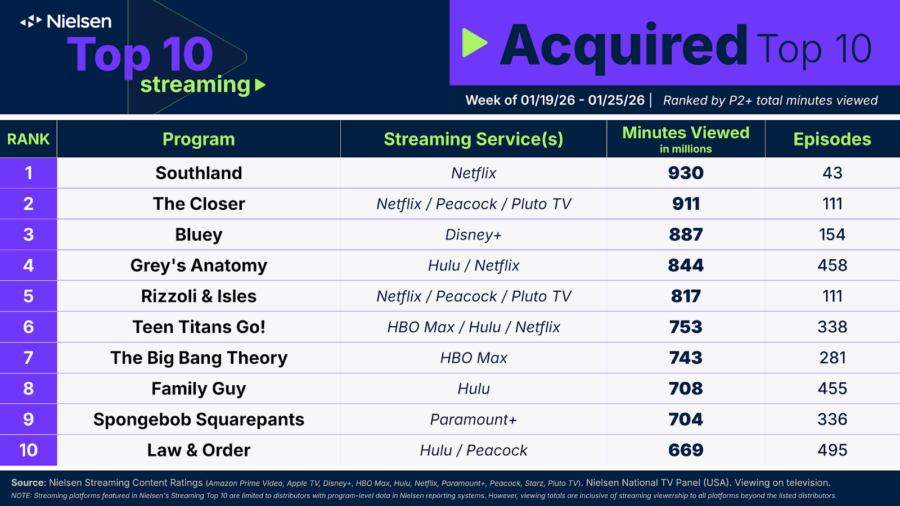
On the acquired chart, “Southland” (930 million minutes, No. 1) and “Rizzoli & Isles” (817 million minutes, No. 5) joined “The Closer” (911 million minutes, No. 2) as the latest former-TNT dramas to benefit from streaming on Netflix.

With the 2026 Oscar nominees announced during this weekly interval, Warner’s Sinners, which scored a record 16 nominations, returned to the top 10 movie chart with 297 million minutes on HBO Max.

The movie was joined by fellow Max title and Best Picture nominee One Battle After Another (215 million minutes, No. 10), which charted for a fourth consecutive week.

Finally, Netflix began licensing the James Bond movie catalog from Amazon MGM Studios, and the 2021 film No Time to Die became the latest top 10 entry from the franchise, hitting No. 2 on the movie chart with 460 million minutes.

Subscribe HERE to the FREE Media Play News Daily Newsletter!

Nielsen: Household TV Viewing Hit 12-Month High in January

Television viewing climbed to a 12-month high in January, rising 3.7% from December, fueled by a 9% monthly increase in cable viewership, in combination with high-stakes sports, returning broadcast dramas and colder winter temperatures that kept audiences indoors, according to new Nielsen monthly data.

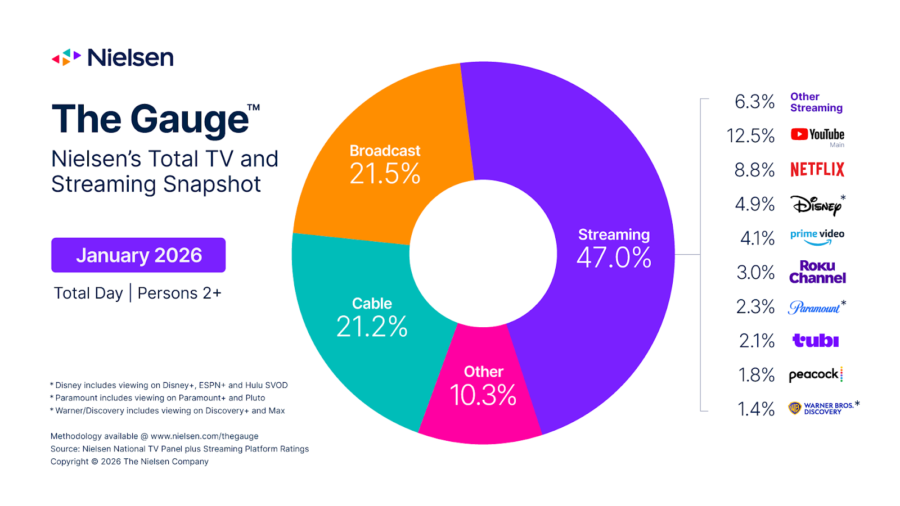
Cable captured the largest monthly viewing increase at 21.2% of total TV. Cable sports viewing surged 49%, propelled by ESPN’s coverage of the college football playoffs, which included the quarterfinals, semifinals and championship games.

ESPN alone saw an 82% monthly viewing uptick. Meanwhile, cable news rose 13%, largely driven by a 17% viewership gain for Fox News, plus a 29% gain for CNN. Notably, ESPN and Fox News each represented 2.2% of total TV usage in January, and together, the two networks comprised 21% of the month’s cable viewing.

Sports remained the anchor for broadcast viewership as football continued to dominate the category. NFL games accounted for the top 15 broadcast telecasts, and the sports genre represented the largest share of the category’s viewership (30%).

Broadcast dramas were also on the rise (up 24%), with “High Potential” on ABC the most-watched drama program of the month. Similarly to cable, the news cycle boosted broadcast news viewing by 10%, led by “ABC World News Tonight.” Overall, broadcast viewership was up 4.2% and represented 21.5% of TV.

Following record viewing levels in December, streaming proved its resilience in January. Time spent streaming increased 2.7% month-over-month and the category continued to represent the lion’s share of TV usage with 47%.

Netflix mirrored the resilience of streaming following its best monthly performance to date. The platform achieved a steady 1% viewing increase (8.8% of TV) versus December, and owned the top streaming program for a second consecutive month, as “Stranger Things” tallied 15.4 billion viewing minutes in January.

Peacock viewership was up 10%, bringing the streamer to 1.8% of TV. Peacock’s monthly uptick was driven primarily by the new season of its original series “The Traitors,” and by audiences watching simulcasts of NFL games carried on NBC.

This cross-platform amplification was most noticeable on Jan. 18 during NBC’s broadcast of the NFL Divisional Playoff matchup between the L.A. Rams and Chicago Bears, which fueled a 78% boost in viewership over its monthly average.

Across the free ad-supported streaming platforms, Tubi and The Roku Channel each claimed monthly increases. Tubi was up 6% to notch 2.1% of TV, and The Roku Channel increased 5% to maintain its platform-best 3% share of TV for a second-consecutive month.

Subscribe HERE to the FREE Media Play News Daily Newsletter!

Nielsen: Netflix’s ‘His & Hers’ Ended ‘Stranger Things’ Reign as Most-Streamed Weekly Household TV Content Through Jan. 18

The Netflix mystery thriller “His & Hers” added more than 800 million minutes in its second week of availability to top Nielsen’s weekly household TV streaming charts with 2.24 billion minutes through Jan. 18.

The tally ended the nine-week No. 1 reign of Netflix’s “Stranger Things,” which added  1.9 billion minutes across 42 episodes at No. 2 overall.

The season two finale of Paramount+’s “Landman” pushed the Billy Bob Thornton-starrer to a new weekly high of 1.77 billion minutes. About 35% of total viewing went to the final episode, and 60% went to the finale and previous episode. Over the course of the 10-week run, “Landman” tallied 10.3 billion minutes, averaging roughly a billion minutes per episode.

Topping the movie chart and No. 4 overall was the Netflix crime thriller The Rip. The Matt Damon and Ben Affleck feature premiered on Jan. 16 and drew 1.39 billion minutes over its opening weekend to become the first feature to cross the billion minute threshold in 2026. Audience-wise, the movie skewed slightly male (51%) and over-indexed the TV population among both Hispanic (26%) and Black (18%) viewers.

HBO Max’s “The Pitt” added 1.16 billion minutes, ranking No. 4 among originals and No. 5 overall. Women 18+ have played a big role in the show’s success, and accounted for 58% of watch time this week.

Two new episodes of Peacock’s “The Traitors” helped drive viewing up 13% to 892 million minutes (No. 6 original, No. 8 overall). Prime Video’s “Fallout” added 844 million minutes (No. 7 original, No. 9 overall), with the highest concentration of men 18-34 (18%) of any original title.

The Hulu original drama “Tell Me Lies” returned for its third season on Jan. 13, totaling 391 million minutes across 21 episodes to rank No. 8 on the  originals chart, with 47% of viewers in the 18-34 demo.

The acquired charts saw the addition of the first five seasons of the animated superhero series “Teen Titans Go!” on Netflix, which promptly added 600 million minutes to rank No. 10. The show had the highest concentration of teen viewers (18%) across the top 10.

Finally, Netflix released the behind-the-scenes documentary One Last Adventure: The Making of Stranger Things 5, which ranked No. 4 among movies with 307 million minutes. Netflix’s People We Meet On Vacation was up 13% from its opening weekend with 618 million minutes in its first full week of availability (No. 2 on the movie chart).

Subscribe HERE to the FREE Media Play News Daily Newsletter!

Nielsen: Super Bowl LX Averaged 124.9 Million TV Viewers; 128.2 Million Watched Bad Bunny Halftime Show

Super Bowl LX on Feb. 8 averaged an estimated 124.9 million TV viewers, according to Nielsen’s Big Data + Panel measurement.

NBC Sports/Peacock’s distribution of the Seattle Seahawks’ 29-13 win over the New England Patriots ranks as the second most-watched Super Bowl in history, behind the 127.7 million viewers who watched the Philadelphia Eagles defeat the Kansas City Chiefs 40-22 in Super Bowl LIX in 2025.

Across the entire telecast, viewership peaked at 137.8 million viewers during the second quarter (7:45-8:00 p.m. ET).

The controversial halftime show featuring Puerto Rican performer Bad Bunny singing entirely in Spanish averaged 128.2 million viewers between 8:15 and 8:30 p.m. ET, dropping nearly 10 million viewers from the game’s peak.

This is the first Super Bowl to be reported using Nielsen’s Big Data + Panel measurement methodology, which was officially rolled out last September.

Super Bowl LX aired from 6:40 p.m. ET to 10:28 p.m. ET on NBC, Peacock, Telemundo, NBC Sports Digital and NFL+. It drew a combined average household rating of 39.4, and combined household share of 79.

Audience estimates are inclusive of out-of-home (OOH) and digital viewing (mobile, PC, MVPD app, vMVPD).

Subscribe HERE to the FREE Media Play News Daily Newsletter!

Nielsen Super Bowl Audience Data

U.S. Television Audience Estimates

Super Bowl

Date

Network(s) / Platform(s)

Total Viewers P2+

HHLD Rating

HHLD Share

LX

Feb. 8, 2026

NBC, Peacock, Telemundo

124,934,000

39.4

79

LIX

Feb. 9, 2025

FOX, Tubi,

Telemundo, FOX Deportes

127,713,000

41.7

83

LVIII

Feb. 11, 2024

CBS, Univision,

Nickelodeon, NAN, Paramount+

123,714,000

43.5

83

LVII

Feb. 12, 2023

FOX, FOX Deportes

115,096,000

40.7

77

LVI

Feb. 13, 2022

NBC, Telemundo

101,470,000

37.9

72

LV

Feb. 7, 2021

CBS, ESPN Deportes

95,877,000

38.4

68

LIV

Feb. 2, 2020

FOX, FOX Deportes

102,086,000

42.0

69

LIII

Feb. 3, 2019

CBS, ESPN Deportes

98,950,000

41.4

67

LII

Feb. 4, 2018

NBC, Universo

104,016,000

43.1

68

LI

Feb. 5, 2017

FOX, FOX Deportes

111,973,000

45.3

70

SB 50

Feb. 7, 2016

CBS, ESPN Deportes

112,336,000

46.6

72

XLIX

Feb. 1, 2015

NBC, Universo

114,810,000

47.5

71

XLVIII

Feb. 2, 2014

FOX, FOX Deportes

112,752,000

46.7

69

XLVII

Feb. 3, 2013

CBS

108,693,000

46.4

69

XLVI

Feb. 5, 2012

NBC

111,346,000

47.1

71

XLV

Feb. 6, 2011

FOX

111,041,000

46.0

69

XLIV

Feb. 7, 2010

CBS

106,476,000

45.0

68

XLIII

Feb. 1, 2009

NBC

98,732,000

42.0

64

XLII

Feb. 3, 2008

FOX

97,448,000

43.1

65

XLI

Feb. 4, 2007

CBS

93,184,000

42.6

64

XL

Feb. 5, 2006

ABC

90,745,000

41.6

62

XXXIX

Feb. 6, 2005

FOX

86,072,000

41.1

62

XXXVIII

Feb. 1, 2004

CBS

89,795,000

41.4

63

XXXVII

Jan. 26, 2003

ABC

88,637,000

40.7

61

XXXVI

Feb. 3, 2002

FOX

86,801,000

40.4

61

XXXV

Jan. 28, 2001

CBS

84,335,000

40.4

61

XXXIV

Jan. 30, 2000

ABC

88,465,000

43.3

63

XXXIII

Jan. 31, 1999

FOX

83,720,000

40.2

61

XXXII

Jan. 25, 1998

NBC

90,000,000

44.5

67

XXXI

Jan. 26, 1997

FOX

87,870,000

43.3

65

XXX

Jan. 28, 1996

NBC

94,080,000

46.0

68

XXIX

Jan. 29, 1995

ABC

83,420,000

41.3

62

XXVIII

Jan. 30, 1994

NBC

90,000,000

45.5

66

XXVII

Jan. 31, 1993

NBC

90,990,000

45.1

66

XXVI

Jan. 26, 1992

CBS

79,590,000

40.3

61

XXV

Jan. 27, 1991

ABC

79,510,000

41.9

63

XXIV

Jan. 28, 1990

CBS

73,852,000

39.0

63

XXIII

Jan. 22, 1989

NBC

81,590,000

43.5

68

XXII

Jan. 31, 1988

ABC

80,140,000

41.9

62

XXI

Jan. 25, 1987

CBS

87,190,000

45.8

66

XX

Jan. 26, 1986

NBC

92,570,000

48.3

70

XIX

Jan. 20, 1985

ABC

85,530,000

46.4

63

XVIII

Jan. 22, 1984

CBS

77,620,000

46.4

71

XVII

Jan. 30, 1983

NBC

81,770,000

48.6

69

XVI

Jan. 24, 1982

CBS

85,240,000

49.1

73

XV

Jan. 25, 1981

NBC

68,290,000

44.4

63

XIV

Jan. 20, 1980

CBS

76,240,000

46.3

67

XIII

Jan. 21, 1979

NBC

74,740,000

47.1

74

XII

Jan. 15, 1978

CBS

78,940,000

47.2

67

XI

Jan. 9, 1977

NBC

62,050,000

44.4

73

X

Jan. 18, 1976

CBS

57,710,000

42.3

78

IX

Jan. 12, 1975

NBC

56,050,000

42.4

72

VIII

Jan. 13, 1974

CBS

51,700,000

41.6

73

VII

Jan. 14, 1973

NBC

53,320,000

42.7

72

VI

Jan. 16, 1972

CBS

56,640,000

44.2

74

V

Jan. 17, 1971

NBC

46,040,000

39.9

75

IV

Jan. 11, 1970

CBS

44,270,000

39.4

69

III

Jan. 12, 1969

NBC

41,660,000

36.0

70

II

Jan. 14, 1968

CBS

39,120,000

36.8

68

I

Jan. 15, 1967

CBS

26,750,000

22.6

43

NBC

24,430,000

18.5

36

SOURCE: Nielsen

Super Bowl LX in 2026 was the first Super Bowl reported using Nielsen’s Big Data + Panel methodology. All prior reporting used Nielsen’s Panel-Only measurement.

The first Super Bowl to include out-of-home (OOH) viewing was SB LV. Nielsen began including OOH viewing into its National TV measurement in September 2020. As of Feb. 2025, Nielsen’s OOH measurement covers 100% of the U.S. contiguous television population.

Super Bowl XLVIII included the first Spanish-language broadcast for a Super Bowl.

Super Bowl I (January 15, 1967) aired on both CBS and NBC.


Nielsen: Netflix’s ‘Stranger Things’ Remained Atop Household TV Streaming for Ninth Straight Week Through Jan. 11

The Netflix original sci-fi series “Stranger Things” grabbed another 3.2 billion minutes in household television viewing across 42 episodes during the week of Jan. 11, maintaining the No. 1 overall and the No. 1 original spts for the ninth consecutive week, according to new weekly Nielsen data.

At a distant No. 2 with 1.43 billion viewing minutes was the Paramount+ original “Landman,” which secured its fourth consecutive week at No. 2 and its eighth consecutive week with more than a billion minutes.

Rounding out the top three was Netflix’s mystery thriller “His & Hers” (1.39 billion minutes). The six-episode drama drew 61% of its viewership from adults 35-64, which was the largest in that age demographic across original series for the week. The series also notably had the highest concentration of Black viewers (27%) of any top 10 original.

Netflix’s Harlen Coben mystery thriller “Run Away” (1.02 billion minutes, No. 4 original, No. 4 overall) picked up steam in its first full week of availability, crossing the billion-minute threshold for the first time.

At No. 5 on the originals chart and No. 7 overall was the second season of the HBO Max ER series “The Pitt,” which achieved a new weekly best with 939 million minutes. The show also recently won the Nielsen ARTEY Award for top new drama series of 2025.

The Hulu miniseries “11.22.63” also found new life on Netflix after landing on the platform Jan. 7. The 2016 series based on the best-selling Stephen King novel drew 848 million minutes, No. 7 among originals and No. 9 overall.

Two reality competition series returned to the originals chart, with Peacock releasing the first three episodes of season four of “The Traitors,” which climbed to a new weekly high of 790 million minutes to land at No. 8.

The show tied “Percy Jackson and the Olympians” for the highest concentration of adults 18-34 (31%) among original titles.

Prime Video dropped the first three episodes of the second season of “Beast Games” on Jan. 7, driving the series to 417 million minutes to land at No. 9 on the chart. About 89% of the show’s weekly total went to the new episodes, and the series attracted the second-youngest audience among originals with a median age of 37.

The Netflix original People We Meet on Vacation topped the movies chart with 549 million minutes. The Disney+ sci-fi sequel Tron: Ares bowed at No. 4 on the movie chart with 258 million minutes, with Asian viewers representing 8% of viewers. Netflix’s Wake Up Dead Man ranked No. 9 on the movies chart with 176 million views. Finally, the 2004 action thriller Man on Fire was on the chart for the second week in a row after joining Netflix. The film had the highest concentration of Hispanic viewers (43%) of any top 10 contender this interval.

Subscribe HERE to the FREE Media Play News Daily Newsletter!

Nielsen Launching New Software to Track Co-Viewing of TV Content, Beginning With Super Bowl LX

Nielsen Feb. 3 announced that it is launching new software to more accurately account for co-viewing of content on television, including live events.

The pilot program will launch with Super Bowl LX on NBC on Feb. 8, and continue for high-profile sports and entertainment live events in the first half of the year. The initial results from the pilot program will be released a few weeks after the delivery of the Nielsen final Big Data + Panel ratings, which are still considered currency.

“Our clients produce live TV events. … It’s our job to make sure we are accurately counting the audiences they meticulously build,” CEO Karthik Rao said in a statement.

The new pilot methodology incorporates the use of Nielsen’s proprietary wearable measurement devices. These are worn on the wrists of Nielsen panelists and resemble a smart watch. The wearables capture audio from TV events, shows and movies, allowing for more passive measurement that does not require a formal log in process.

The co-viewing estimates from the pilot program will not be immediately included in Big Data + Panel ratings from Nielsen. As such, they will not be considered data that advertisers transact on, but the pilot data will be made available to Nielsen clients following the delivery of Big Data + Panel ratings.

Ad clients will be able to share those findings publicly. Nielsen will provide additional impact data to clients later this year, before the co-viewing methodology is fully implemented into its suite of marketing intelligence products with a goal of incorporating it in “currency” measurement for the 2026-27 season.

This co-viewing enhancement is the first phase, with additional co-viewing enhancements planned beyond 2026.

Subscribe HERE to the FREE Media Play News Daily Newsletter!

Nielsen: Netflix’s ‘Stranger Things’ Breaks Own Weekly Streaming Record Through Jan. 4

The “Stranger Things” series finale hit Netflix on New Year’s Day and quickly generated a record-breaking weekly viewing total of 8.65 billion viewing minutes across 42 episodes through Jan. 4, according to new data from Nielsen. The sci-fi drama now holds the four biggest single-week totals of any streaming title on record.

Although the show’s viewing total did not contribute to its accumulated viewership in 2025 (which concluded on Dec. 28), “Stranger Things” still clinched the top original title of the year with 40 billion viewing minutes.

The Paramount+ original “Landman” captured 1.58 billion minutes, marking its seventh consecutive week with more than 1 billion minutes, and third consecutive finish at No. 2 overall. The Billy Bob Thornton-starrer has charted on the originals chart each week since its second season began on Nov. 16. The series also finished as the No. 4 streaming original of the year with 18.9 billion minutes generated in 2025.

The “Netflix Effect” continued to work in favor of “The Closer,” as the catalog police drama gained nearly 500 million minutes week-over-week to finish at No. 3 overall and No. 1 among acquired titles with 1.43 billion minutes across 111 episodes on Netflix, Pluto TV and Peacock. Adults 50+ were the main drivers of viewing, contributing 70% of watch time.

“Homeland” tabulated its largest weekly total yet with 1.08 billion minutes across 97 episodes on Netflix and Hulu, taking No. 4 overall.

Children’s animated show “Bluey” gained about 200 million minutes week-over-week to total 1.06 billion minutes across 154 episodes on Disney+. This marks the 55th time the series has reached the billion-minute mark in the top 10. The animated series was crowned the top overall streaming title for the second year in a row with 45.2 billion minutes in 2025.

Prime Video’s episodic release strategy for season two of “Fallout” has led to consistent week-over-week gains for the series. The sci-fi series climbed to 962 million minutes across 11 episodes, having added episode three on Dec. 31. The show ranked No. 3 on the originals chart and moved up to No. 6 overall. “Fallout” also continued to lead top 10 originals among the 18-49 age demographic, which represented 59% of its viewing this week.

Two new original series made their top 10 debuts during the week. “Run Away” on Netflix notched 862 million minutes to land at No. 4 among originals and No. 7 overall. Peacock’s “The Copenhagen Test” (373 million minutes, No. 10 original) also drew the highest concentration of Black viewers (20%) and the highest concentration of Asian viewers (12%) across all top 10 titles.

HBO Max’s “The Pitt” (495 million minutes, No. 7) returned to the originals chart for the first time since season one wrapped in April 2025, as viewers awaited the season two premiere on Jan. 8.

With Christmas over, the Netflix true crime documentary Evil Influencer: The Jodi Hildebrandt Story (620 million minutes) ranked No. 1 on the movie chart.

Avatar: The Way of Water (249 million minutes, No. 8) on Disney+ returned to the movie chart for the first time since last July, following the theatrical release of the sequel Avatar: Fire and Ash on Dec. 19. Zootopia (260 million minutes, No. 7) returned as the theatrical run of Zootopia 2 continued through the holidays.

This Week’s Media Play News Video Podcast: Netflix’s Streaming Dominance, Nielsen Gaps and the End of Peak TV

Netflix keeps winning the streaming charts — but are the numbers really telling the full story?

In this Media Play News Jan 28 conversation, Next TMT co-founders David Bloom and Daniel Frankel break down the latest Netflix performance data, the growing limitations of Nielsen streaming measurement, and why comparing platforms with vastly different audience sizes still distorts industry rankings.

Subscribe to Media Play News’ FREE daily newsletter here for your daily dose of what’s happening in streaming and home entertainment.

Sign up for the free NextTMT.com newsletter to get the latest news and analysis on what’s happening in technology, media and telecom.

From Around the Web